|
By Patricia M. Johnson and Richard F. Outcalt
Principals, Outcalt & Johnson: Retail Strategists LLC
Youve done it! Youve worked and budgeted and saved, and now youre able to take a three-week vacation! So…where will you go? How about an island adventure? You might want to choose a few islands where youll be able to spend some time reaping the benefits of an unknown but enticing culture.
How do you decide on which islands to visit and how much time you spend on each of them? Your spouse wants to visit the ones with the shops, your kids want the surfing (little do they know theyre not going!), but you want to scuba dive. How do you choose? Ultimately, you will choose to visit the islands that contribute the most to your relaxation and well being.
The Job of Choosing Begins with Wellness
Well being. Thats a key phrase because you should be using the same approach to choose which products to offer in your uniform and career apparel business. Logically, you will choose the items that contribute the most to your companys total financial well being.
To help make those choices, we often recommend to our clients the use of contribution margin analysis. Understanding contribution margin leads to a second valuable conceptbreakeven. (Well talk more about breakeven later.)
Contribution margin analysis is a method of choosing, among the sea of products you offer, those that contribute the most to covering your business expenses. When first beginning a contribution analysis, you must sort your expenses into two categories: variable and fixed.
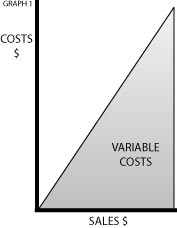 Variable Costs change in proportion to sales, rising as a company gains more business. They are often considered direct costs because sales actually cause them. Variable costs usually include cost of the merchandise, freight, advertising, sales commissions and other direct labor (see Graph). Variable Costs change in proportion to sales, rising as a company gains more business. They are often considered direct costs because sales actually cause them. Variable costs usually include cost of the merchandise, freight, advertising, sales commissions and other direct labor (see Graph).
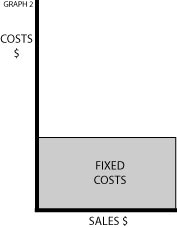
Fixed Costs (see Graph) are those that generally stay the same from month to month and do not vary according to sales. Rent, utilities, insurance, interest, administrative wages and salaries are all examples of expenses that are fixed, or indirect. Remodels and expansions are other expenditures likely to impact fixed expenses.
(A caution: Dont agonize for hours over the proper classification of an expense. In reality, many costs are a combination of both variable and fixed. So just do the best you can. The most conservative approach would be to designate a questionable expense as a fixed cost.)
Covering Your Costs
Variable and fixed costs filter down through your business. Every product has variable costs that are directly attributable to its purchases and subsequent sales. These costs are effectively covered by sales. Fixed costs must be covered no matter what sells and at what price.
The degree to which your products each contribute to covering your fixed costs (and thus freeing up more profit) is what contribution analysis is all about.
Written out, the basic math behind contribution analysis is:
Total Sales Variable Costs = Amount left for Fixed Costs/Profits
Convert the dollar figures into percentages and the equation becomes:
100% Variable Cost =% of Sales
(You arrive at a Variable Cost Percent like this: Variable Costs/Total Sales = Cost %.)
 The contribution margin formula can be applied to any product, any department or to your business as a whole. But, just what does that mean, and how do we use it? The contribution margin formula can be applied to any product, any department or to your business as a whole. But, just what does that mean, and how do we use it?
Lets take Mr. Spen Dalotts business as an example. Last year he added a new department, selling only three products. (Yes, this is simplified, but this is just an example!) Mr. Spen Dalotts sales totaled $180,000, with variable costs totaling $120,000. The remaining $60,000 thus contributed toward fixed costs ($50,000) and profit ($10,000).
At first, Mr. Dalott was happy to see that all his products sold well and made a profit. But even a small adjustment in product distribution could have significantly increased his profit with no increase in total sales.
Now lets take a look at two different scenariosone last year and one this yearto see how product distribution affects Mr. Dalotts business.
Last year, Product A contributed $15,200 toward fixed costs and profit. ($40,000 in total sales minus variable costs of $24,800 equals $15,200). To find Product As contribution margin, a percentage, we first find the variable cost percentage, which is 62% ($24,800/$40,000 = .62). Next, subtract the variable percentage from 100 for a contribution margin of 38% (100% – 62% = 38%).
In other words, out of one sales dollar made on Product A, $.62 went to variable costs and $.38 were left to contribute to fixed costs and profit.
The contribution margins of Product B and C were 25% and 39%, respectively.
Since Mr. Dalott wanted to increase profits, he weighed some changes based on the data he found. Whereas Product C had the largest contribution margin of the three products, Mr. Dalott knew his potential to sell that product had been pretty well tapped. Product A, however, had a large growth market. Based on this knowledge, he channeled nearly all marketing efforts toward Product A. Heres what happened:
Although this years total sales remained the same at $180,000, the result of the redirected marketing efforts increased sales of Product A dramatically. Sales of Product B dropped substantially, but the new product balance reduced overall variable costs by $3,100 ($120,000 minus $116,900), which produced an increase in the contribution. With fixed costs still at $50,000, net profit was now $13,100, a 31% increase in profits!
All retailers are facing increased price competition today. Products that once reliably generated 40% or more in margin no longer do. As a result, many uniform and career apparel retailers are scrambling to gain back gross margin dollars.
Using this formula can be very helpful to you in deciding which categories of merchandise to carry or dropa tough but necessary decision in todays retail climate as we dont see the good old days returning.
Planning Pays Off
Back to that vacation; it seems well worth the effort to do a little research and advance planning, doesnt it? In so doing, you can find the right islands for your family with the most to offer in order to maximize your time away.
Believe us, its worth just as much, and even more, to plan which products will give you the most for your effort in your business. You can then direct customers toward the products that have the largest contribution to your bottom line.
Get the most from the products you carry. Contribution analysis helps you pinpoint just where to begin, but it doesnt end there!
Another equally valuable tool in getting the most out of your products is the breakeven analysis. Breakeven analysis combines fixed costs with the contribution margin to reveal the sales volume at which you breakevenwhere there is neither a profit or a loss.
Consider again the case of Mr. Spen Dalott. He had analyzed only which products contributed most to his fixed costs and profit, but he had never really seen where his business had been, nor where it was going. He had been very lucky so far, which can tempt most any person to avoid making the time for planning. So, before he takes any big steps, he needs to chart just where hes likely to end up.
Breakeven is a safety net; it is the sales volume at which you neither make a profit nor incur a loss. To rephrase: The breakeven point is where revenues equal costs.
You should use the same designations of all expenses as variable or fixed. Mr. Dalott found that this was, in fact, the most difficult part of the entire breakeven analysis! But once that was done the rest is fairly straightforward.
To determine your breakeven point, use this formula:
Fixed Costs/Contribution Margin % = Breakeven
Breakeven 101: The Course at a Glance
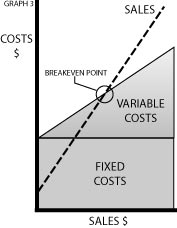
The total structure of these costs (variable and fixed) relative to sales is shown in Graph 3. The breakeven point (circled) is the point at which sales equal total costs.
As you can see, every change in sales also changes variable and fixed costs, altering the structure and the breakeven point. Using the breakeven formula applied to a graph can help you evaluate the implications of each potential change.
Now, lets consider Mr. Spen Dalotts opportunities.
1. What is Mr. Dalotts breakeven point given variable costs at 65% of sales and fixed costs of $50,000?
$50,000/(100% – 65%) = $142,900
2. How would a 2% reduction in contribution margin change Mr. Dalotts breakeven point?
$110,000/33% = $333,300 (new breakeven)
3. With his current contribution margin of 35%, what sales volume is required to earn a $40,000 profit? (Given: Fixed costs = $110,000; Variable costs = 65% of sales; Desired profit = $40,000)
($110,000 + $40,000)/35% = $428,571 required sales
Note: In the above example, we add the $40,000 to fixed costs. The result is not really a breakeven figure because weve allowed for $40,000 profit.
Using these simple exercises, Mr. Dalott learned that lower product contribution marginseven in small incrementsmeans many more sales to break even. He also determined how much he would need to increase sales in order to impact profits. With these figures in mind, hes ready to budget realistically for growth and forecast the impact of new product mixes.
With Knowledge Gained, Other Uses Arise
In fact, Mr. Dalott was so impressed with the information gained from his breakeven analysis, he began to incorporate it into his business decisions as a fundamental tool. With some thought he found that breakeven guidelines could assist in providing:
Pricing Determinations How will a reduction or increase in prices affect the overall cost/revenue structure of the business?
Wage and Benefit Guidelines Will the cost of wage increases and benefits be justified by sales?
Budgeting Aids Are expenses in line with income?
Sales Improvement Campaigns Where should renewed sales efforts be directed?
Capitol Spending Assessment How will adding on affect the business? Remodel the existing space? Open a second store?
Both contribution margin and breakeven analysis involve simple calculations and provide solid general data as long as historical data are available. Neither one are a magic formula for business, but both are real tools to assist in quality planning. Whenever any costs and/or prices change, the analysis will need to be repeated.
So, just as vacation time is richer when well planned, business time is better spent when mapped out for maximum return.
|